
This will help export an insights+ chart image as an SVG file for further editing. It is recommended you use CHROME to do this.
Exporting an Image
- Navigate to the insights+ page containing the image you wish to export.
- Open the Developer Console
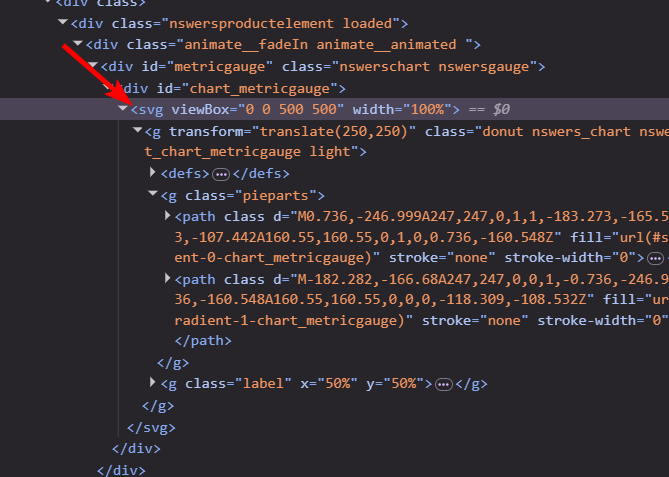
- Right click on the image and click on Inspect
- Make sure the SVG element is selected in the Elements tab:
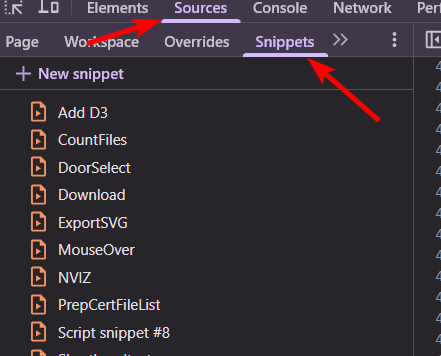
- Select the Sources tab.
- Select the Export snippet.
- If this is not available, see instructions for adding below.
- Select the Snippets sub-tab.
- Click on the Run option (looks vary by operating system)
- Provide a name in the pop-up and click OK.
Creating the Export snippet.
- Open the Developer Console
- Right click on any page and click on Inspect
- Select the Sources tab.
- Select the Snippets sub-tab.
- Click on the + New snippet link
- Paste the following code into the new editor window:
let header = `<?xml version="1.0" encoding="UTF-8" standalone="no"?>
<!DOCTYPE svg PUBLIC "-//W3C//DTD SVG 1.1//EN" "http://www.w3.org/Graphics/SVG/1.1/DTD/svg11.dtd">`
let name = prompt("Filename?", "export");
let text= $0.outerHTML;

if ( text.substr(0,4) != "<svg") {
  alert("Make sure you have the SVG element selected.")
} else {

var element = document.createElement('a');
  element.setAttribute('href', 'data:text/plain;charset=utf-8,' + encodeURIComponent(header + text));
  element.setAttribute('download', name + '.svg');
  element.style.display = 'none';
  document.body.appendChild(element);
  element.click();
  document.body.removeChild(element);
} - Hit Ctrl+S or [Apple] + S to save
- Right Click temporary name (something like Script snippet #1 and rename to Export)
Leave a Reply